

Reason to trust
![]()
Strict editorial policy that focuses on accuracy, relevance, and impartiality
Created by industry experts and meticulously reviewed
The highest standards in reporting and publishing
Strict editorial policy that focuses on accuracy, relevance, and impartiality
Morbi pretium leo et nisl aliquam mollis. Quisque arcu lorem, ultricies quis pellentesque nec, ullamcorper eu odio.
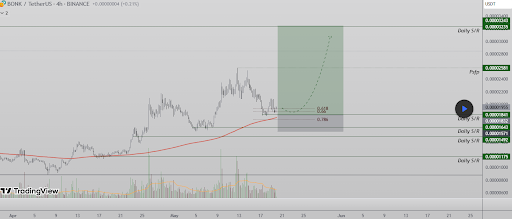
BONK’s price action has been back and forth in May, and the cryptocurrency is now essentially back where it started the month. Recent price action reveals that the token is attempting to stabilize at around the 200 EMA after being rejected by the local high near the 0.00002581 level.
This rejection led to a measured pullback towards $0.00001820. However, according to a technical analysis on the TradingView platform, the retrace appears to be forming a bullish continuation setup with a 77% corrective move in view rather than indicating a bearish reversal.
Bullish Market Structure Holds Firm For BONK
BONK’s price retracement has brought it directly into a zone of heavy technical interest. At the heart of this confluence lies the 200 EMA on the 4-hour timeframe, which could technically serve as the next support zone for the meme coin moving forward. In addition, the retracement aligns with the 0.618 Fibonacci level, which is commonly associated with bullish corrections. It also aligns with a daily support zone around $0.00001832 to $0.00001841 and a resistance zone around $0.00002034.
Related Reading
Interestingly, this movement has led to a consolidation between these levels since May 15, and according to the TradingView analyst, the price structure suggests buyers are stepping in to defend the trend. This, in turn, has led to the formation of a higher low.
From a volume standpoint, each upward impulse has shown rising volume since the first week of April. However, the recent decline occurred on diminishing volume, hinting at exhaustion from sellers.
77% Upside Move If BONK Breaks Above Resistance
Even with the current range, BONK is still within a bullish setup that could send it towards a new 2025 high and possibly towards its current all-time high levels. The important level to watch now is the point of control (POC) resistance at approximately $0.00001955. This level previously acted as the pivot point before the pullback and now serves as the threshold for bullish continuation.
Related Reading
A confirmed close above this region would likely trigger a rapid expansion move toward the next resistance cluster around $0.00002581, before eventually reaching the predicted price target of $0.00003243, which would bring it close to its January 2025 open of $0.000035. As such, the projected target if this plays out will translate to a 77% rally. The price target also aligns with a previous swing high on January 15 and January 18.
At the time of writing, BONK is trading at $0.00001995, up by 1,6% in the past 24 hours. Its reaction here, just above the POC resistance, will be an important deciding factor. If buyers manage to maintain pressure and secure a decisive breakout, the stage could be set for a strong rally into the upper resistance band and a retest of BONK’s 2025 swing high.
Featured image from Shutterstock, chart from Tradingview.com